Creative Overview – Visualize and Compare Ad Asset Performance
Last updated: November 4, 2025
As ad platforms shift toward automation, creatives become the key driver of performance. StoreHero’s Creative Overview makes it easier to analyze image, video, and copy results—something native
What You Can Do in the Creative Overview
1. Explore All Ad Creatives in One Place
Toggle between images, videos, and copy assets
Use filters, sort options, and time selectors to compare performance
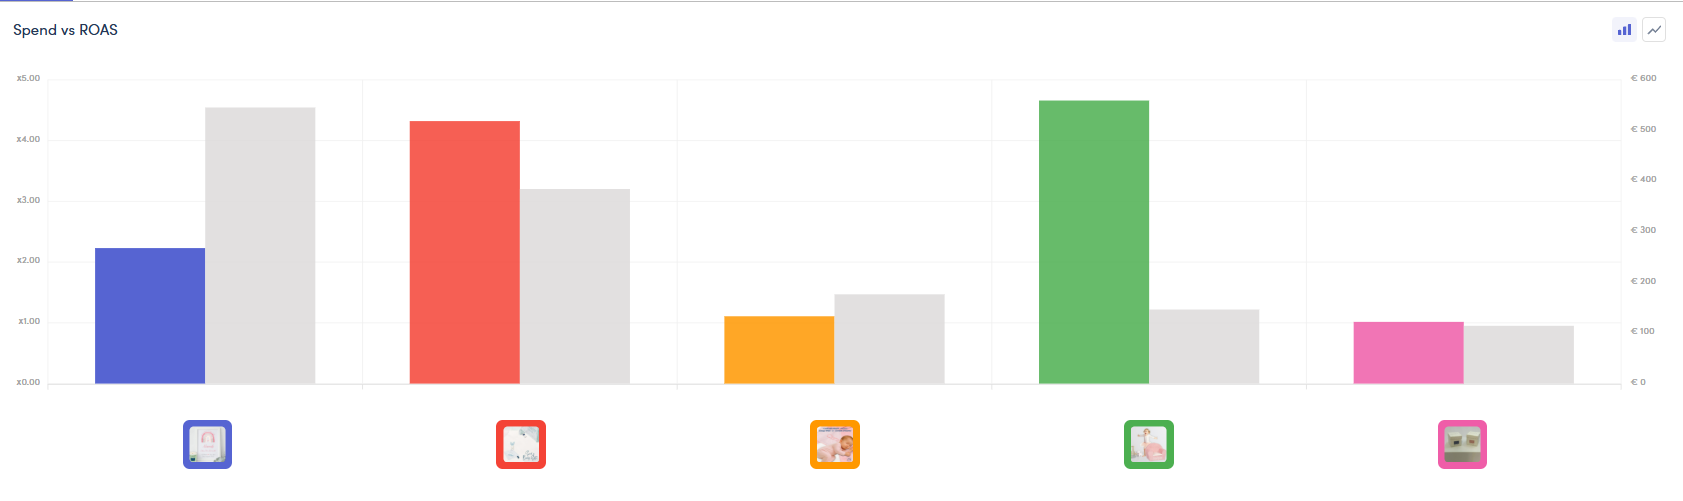
View results in row view, with options to switch between:
Line Graphs

Bar Graphs
2. Filter to Focus on Key Assets
Use the filter icon to define and save asset-level filters, such as:
Top-performing videos
Creatives with at least 5 purchases
Specific campaign assets
You can create custom filters or choose from predefined ones.


3. Sort by What Matters
Customize your view by sorting creatives based on:
Spend
ROAS
Purchases
Click-to-purchase rate
4. Adjust Date Range & Compare Periods
Set a preferred date range and optionally compare against a previous period.

5. Choose How You View Data
Tile View shows multiple creatives visually
Row View includes additional metrics, visualized with trend graphs


6. Use Heatmaps to Spot Outliers
Activate the heatmap toggle above your data table or chart to highlight high- or low-performing metrics.


Recommended Metrics to Track
While ROAS is helpful, these two additional metrics give deeper insight into creative quality:
1. Thumb Stop Rate (for video)
% of viewers who watch the first 3 seconds
High = strong hook or attention-grabbing start
2. Click-to-Purchase Rate
% of clicks that convert into purchases
More useful than CTR alone, it shows intent and conversion quality
You don’t always need both to be high, but typically at least one strong metric is needed for a creative to deliver a solid return.
Best Practices
Review top creatives weekly and tag high-performers
Use filters to isolate strong vs. underperforming variants
Focus on Thumb Stop Rate + Click-to-Purchase % for actionable insight
Use the bar or line graph views to compare asset performance over time